SAP ABAP(Advanced Business Application Programming) is a programming language used to create custom applications for the SAP ERP system. One of the most important tasks
for any SAP ABAP developer is debugging. In this article, we will discuss the various debugging tools and techniques available in SAP ABAP, and how to use them effectively to troubleshoot and fix errors in your code.
What is ABAP Debugging
ABAP debugging is the process of identifying and resolving errors in ABAP code. It is a feature provided by the ABAP Workbench, which allows developers to step through their code, set breakpoints, examine variables and program call stack watch expressions, and much more. With the help of debugging, developers can identify the root cause of an error, and test the code to make sure that it functions as intended.
The ABAP Debugger also allows you to set breakpoints in your code. A breakpoint is a marker that tells the debugger to stop execution at a certain point in the code. This is useful for isolating a specific section of code that you want to examine in more detail. To set a breakpoint, simply click on the left margin of the code editor next to the line of code where you want the breakpoint to be placed. In addition to breakpoints, the ABAP Debugger also provides several other debugging tools such as Watchpoints, Call Stack, Local, and Global variables, and much more. These tools allow you to monitor the values of variables, check the call stack, and perform other advanced debugging tasks. One of the most useful features of the ABAP Debugger is the ability to inspect the contents of data objects and variables. When you are stopped at a breakpoint or step point, you can hover over a variable to see its current value, or you can add it to the "Watch" window to monitor its value as you step through the code. You can also view the contents of internal tables, structures, and other complex data objects using the "Data Browser" button.
Debugging in SAP ABAP is done using the ABAP Debugger. This tool allows you to step through your code line by line, and inspect the values of variables and data objects. The ABAP Debugger can be accessed by pressing the "Debugging" button on the standard toolbar, or by using the shortcut key combination Ctrl+F5.
Important transaction code in ABAP Debugging :
1) SE38: This is the ABAP Editor for Programs, where you can create and edit ABAP programs.
Important: An ABAP program can contain hundreds or even thousands of lines of
code, so it is impossible to go through the program line by line to find the
problem. It is therefore essential to master the use of breakpoints because if you
think the problem is at a certain level in your program, you can simply place your
breakpoint at that level and SAP will stop processing the program at that level and
run the debugger.
4. Debbuging Screen
To explain the debugging screen, I will use the sales order transaction (VA01), type “/h” in the transaction bar, and then run the transaction. This will allow us to access the program in debug mode.
You will probably see the screen below
Let us discuss this section by section.
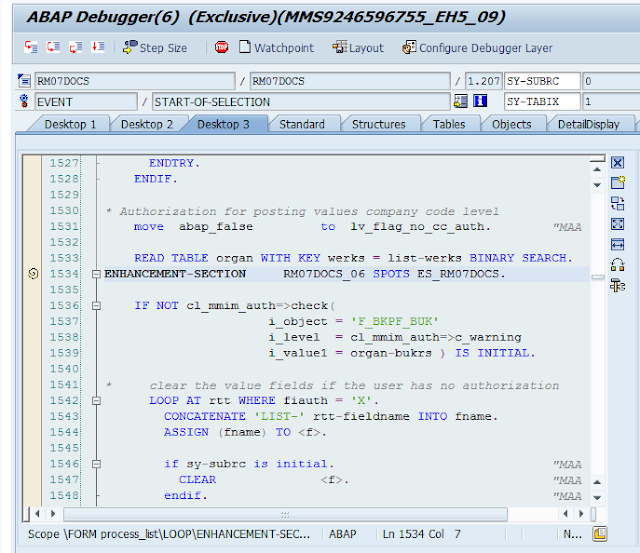
At the top of the debugging screen Here you can easily read the name of the program and also see the event being processed (function/method).
SYST structure:
Necessary: if SY-SUBRC is 0 the ABAP statement has been executed successfully if
the value is different from 0 then the statement has raised an error or warning.
SY-TABIX: returns the number of the current line in a processing loop.
Watch-Points
In SAP ABAP, a watchpoint is a feature that allows developers to pause program execution when a specific variable or field is accessed or modified. This can be useful for debugging and troubleshooting issues in an SAP system. To set a watchpoint, developers can use the ABAP Debugger and navigate to the variable or field in question, then right-click and select "Watchpoint" or "Breakpoint". Once the watchpoint is set, the program will pause execution when the variable or field is accessed or modified, allowing the developer to investigate the current state of the program and identify any issues. Developers can also set watchpoints on specific lines of code using the command "BREAK-POINT" in the code.
Most of the time, an internal table contains thousands of rows. If we need to debug a particular row, for example, the item number which is in the 300th row of an internal table, knowing that this internal table contains more than 10,000 rows in this case, it is very difficult, if not impossible, to debug an internal table row by row to reach this particular row. To save time, it is sufficient to define a watchpoint for the particular value of a field or variable.
How to use a watchpoint? Let’s take 2 scenarios:
#
Create watchpoint
You will get this message
You can also check in the watchpoints tab
And execute the program (F8)
#
Scenario 2: For example, there are 9464 entries in the internal table. Let's see how to analyze the 2247th record, i.e. the Sales order number "0000007357".
Go to se38 and open your program in debug mode
Create watchpoint
#
You will get this message
You can also check in the watchpoints tab
And execute the program (F8)
And finally, you will get this confirmation message
6. Changing Variable Values:
One of the essential features of the SAP debugger is the ability to change the values of variables "on the fly".
Sometimes, when we debug for testing purposes, we need to change the values of variables to test several scenarios or to see the behavior of the program. And even during troubleshooting, changing the value of a particular variable can help solve the problem.
However, it is important to ensure that you have permission to do so, otherwise, the system will not allow you to change a field. You should therefore contact the SAP security team to obtain the necessary permissions.
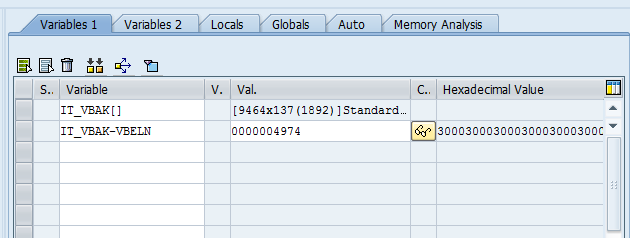
Let’s see how we can change the value For the testing purpose we will change the Sales Order number (from 0000004974 to 0000005074) to see the behavior of the program
Click on the pencil icon to make the field editable
#
7. Real-time Debugging:
a) Debbuging pop-up screen:
In SAP we encounter pop-up screens every day, but there are scenarios where a pop-up screen needs to be debugged to find the exact cause of the error. One of the most important difficulties is that command line debugging is not possible if pop-up screens appear: because you cannot edit /h What you need to do is save the line of codes below to a text file on your laptop or desktop. And when it's time to debug, just drag and drop the text file you saved on your desktop or laptop onto the pop-up screens.
Let’s take an example
During a transaction, we get this pop-up screen here below Our task now is to find out exactly which line of the ABAP code contains this error by debugging.
Just drag and drop the text file you saved on your desktop or laptop onto the popup screens.
You will get this message
And click on the green button
b) Debugging of Enhancement
#
Enhancements: enables customers/clients to add custom business functionality
to sap standard software without changing at all the sap standard functionality
(which is supposed to be unchanged).
#
Go to se38 and open your program in debug mode
#
With the (F5 key) you can start debugging your enhancement step by step
#
Let’s see how we can debug the error message A user sends you this screenshot by email:
Our task now is to find out exactly which line of the ABAP code contains this error by debugging.
Open the program in debugging mode
Go to the breakpoint at the message
Enter the information contained in the error message
And execute
As you can see above the program has stopped exactly at the point where this error occurs.
In conclusion, debugging is an essential part of the SAP ABAP development process. The ABAP Debugger provides a wide range of tools and techniques to help you troubleshoot and fix errors in your code. By learning to use these tools effectively, you can save time and improve the quality of your code.


-min.jpg)
0 Comments